Transit visibility
The function transitTimes() provides a table containing, among others,
mid-transit times, altitude above horizon, and Moon distance and phase; i.e., the most relevant
information to evaluate whether a transit is observable at a particular point.
Using transitVisibilityPlot(), the data can be plotted to obtain a
visual impression of the visibility.
Example of usage
The following example demonstrates the use of the functions. Both code and output is shown.
Code
from PyAstronomy import pyasl
import datetime as dt

# Convert July 14th, 2018, 10pm to a Julian date
d = dt.datetime(2018, 7, 14, 22)
jd = pyasl.jdcnv(d)

# Calculate transit data for transits within 100 days starting
# form July 14th, 2018.
dat = pyasl.transitTimes(jd, jd+100., "WASP-7 b",
                         observatory="esoparanal", obsOffset=1./24.,
                         minAltitude=10.0)
# Plot the result
pyasl.transitVisibilityPlot(dat, markTransit=True)
Text output
Specified time span
Start date (DDDD-MM-YY and fractional hours): 2018-07-14 21.962
End date (DDDD-MM-YY and fractional hours): 2018-10-22 22.129

Transit duration:  226.512  minutes
Off-transit time before and after transit:  60.0  minutes

No. Tmid [HJD]      Obs. start [UT] [ALT, DIR(AZI)]     Transit mid [UT] [ALT, DIR(AZI)]     Obs. end [UT] [ALT, DIR(AZI)]   twilight (SUN ALT)                   moon distance     moon phase
  1 2458394.66052    3.10.  0:57    [ 75°,S(193°)]       3.10.  3:51     [ 47°,W(238°)]       3.10.  6:44  [ 14°,W(233°)]                night (-30°,-59°,-46°)   (153°,154°,155°)   42%
  2 2458399.61518    7.10. 23:52    [ 74°,S(159°)]       8.10.  2:45     [ 56°,W(235°)]       8.10.  5:39  [ 22°,W(235°)]     astron. twilight (-15°,-50°,-55°)   (122°,121°,119°)    1%
  3 2458404.56984   12.10. 22:47    [ 68°,S(137°)]      13.10.  1:40     [ 64°,W(229°)]      13.10.  4:33  [ 31°,W(237°)]       civil twilight (  0°,-37°,-57°)   ( 60°, 58°, 57°)   18%
  4 2458409.52449   17.10. 21:42    [ 60°,E(127°)]      18.10.  0:35     [ 71°,S(214°)]      18.10.  3:28  [ 40°,W(238°)]                  day ( 14°,-23°,-52°)   ( 20°, 20°, 20°)   63%
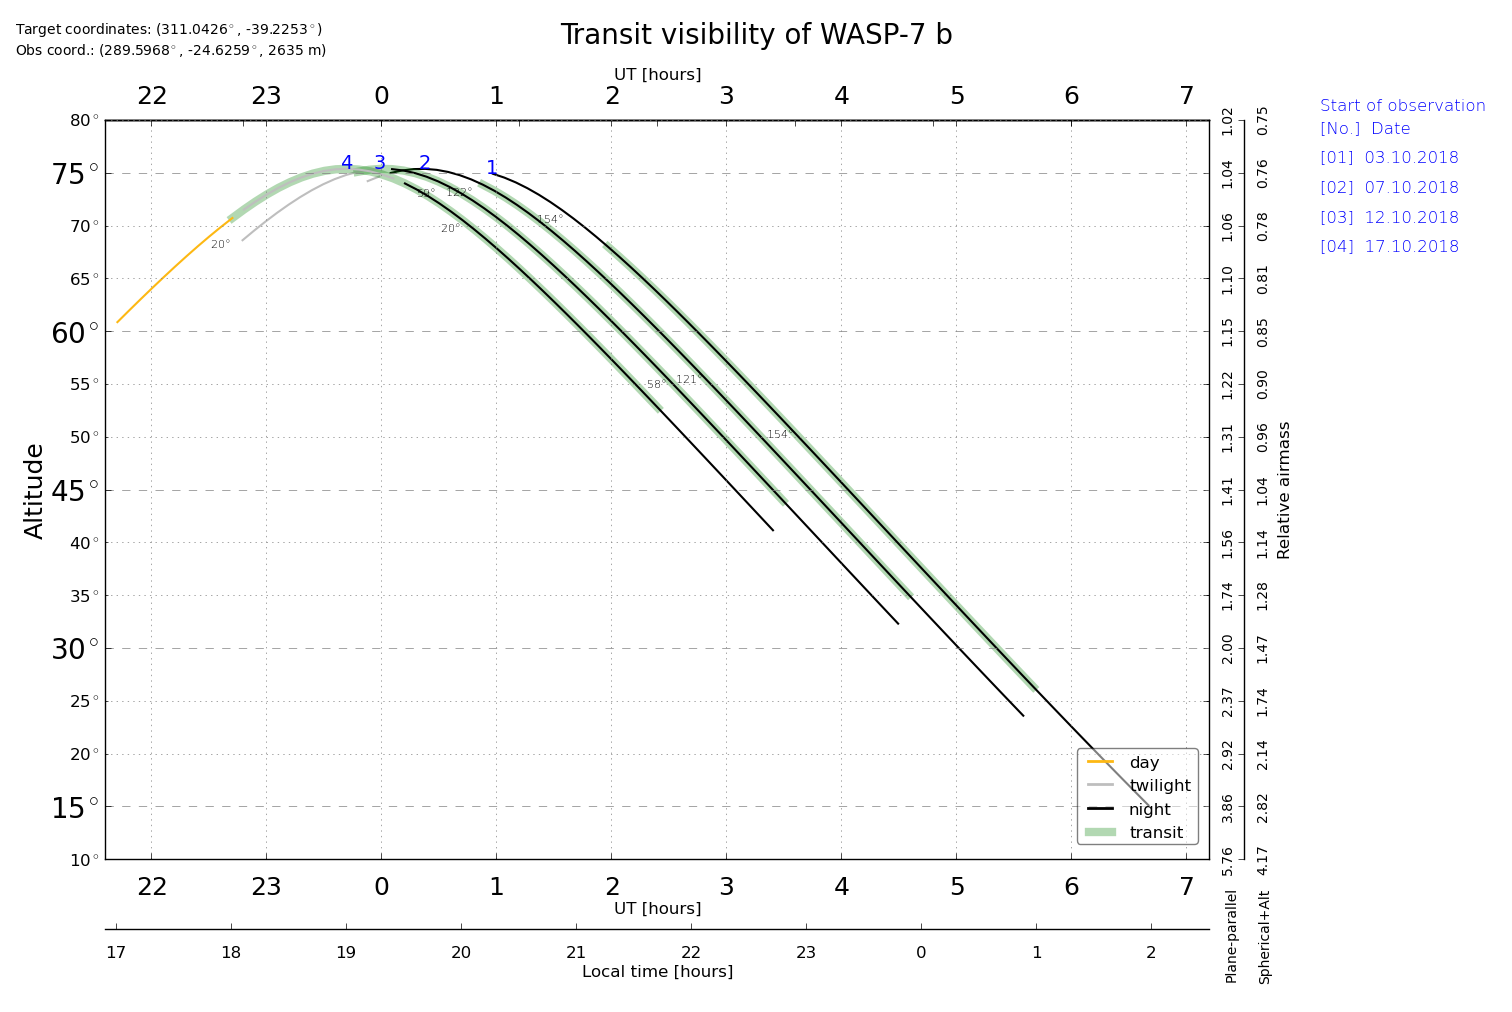
Graphical output
The figure shows the product of the transitVisibilityPlot function. In this case, four transits are shown in the form of altitude (or airmass) as a function of UT and local time. The numbers indicate to which transit the individual lines refer. The color of the thin lines indicates the light conditions (e.g., twilight or astronomical night). The green overlay indicates the time of transit; here, we have one hour of additional time before and after the transit, which was specified on the call to transitTimes. On the right, you see the dates at which the observation (not necessarily the transit) starts.
API
- PyAstronomy.pyasl.transitTimes(tmin, tmax, planetData, obsOffset=0.0, hjd=True, observatory=None, lon=None, lat=None, alt=None, minAltitude=None, showTwilight='all', moonDist=None, nexaInput=False, fileOutput=None, psT0=0.0)
Calculate transit times for a given planet and a given period of time.
The planetData dictionary must contain the following information:
Key
Value
ra
Right ascension of object [deg]
dec
Declination of object [deg]
T0
Time reference point (HJD)
orbPer
Orbital period [d]
orbInc
Orbital inclination [deg]
SMA
Semi-major axis [AU]
RpJ
Planetary radius [Jovian radii]
RsSun
Stellar Radius [solar]
Tdur
OPTIONAL, Transit duration [d]
If the transit duration (Tdur) is not given, the duration will be estimated using pyasl’s transitDuration function.
Note
The input times (tmin and tmax) are expected in JD (UT). Input time will be calculated to HJD. Time output is in HJD.
- Parameters
- tminfloat
Start of time interval in Julian days (UT).
- tmaxfloat
End of time interval in Julian days (UT).
- planetData: dictionary or string
Either a dictionary containing the parameters of the exoplanet for which the transit times should be calculated or the name of the planet (e.g., ‘WASP-12 b’). In the case of a string, an attempt will be made to download the data from a database. The required keys for the dictionary are specified above.
- obsOffsetfloat, optional
Specifies additional time before AND after the transit in DAYS. This is useful if the observation should start and end some time before and after the actual transit.
- hjdboolean, optional
If True (default), the given Julian dates specifying the time interval (tmin and tmax) are automatically converted into the heliocentric frame (HJD).
- observatorystring, optional
If given, pyasl’s observatory function will be used to automatically resolve the name and obtain longitude, latitude, and altitude of the observatory. If observatory is given, lon, lat, and alt must not be specified.
- lonfloat, optional
East longitude of the observatory given in DEGREES.
Longitude is positive in EASTWARD direction. If LON is not given, transitTimes will only return beginning and end of the observation and the time of mid transit.
- latfloat, optional
Latitude of the observatory given in DEGREES (positive in NORTHWARD direction).
- altfloat, optional
Altitude of the observatory given in METER.
- minAltitudefloat, optional
Minimum altitude of the object in DEGREES.
If a minimum altitude is given, only transits for which the object is above the given altitude during the ENTIRE observation are included in the list created by transitTimes. Note that minAltitude can only be used if the observer’s location has been specified either via observatory or via lon, lat, and alt.
- showTwilightstring, optional, {“all”, “civil”, “nautical”, “astronomical”, “night”}
Specifies the twilight acceptable during the observation. By default all twilight conditions are acceptable.
Only the transits for which the ENTIRE observation occurs during the specified or darker twilight conditions are listed.
- The choices are:
“all”: all transits are shown (even during day)
“civil”: only transits during civil twilight and better are shown
“nautical”: only transits during nautical twilight and better are shown
“astronomical”: only transits during astronomical twilight and better are shown
“night”: only transits during night are shown
Note that this can only have an effect, if the observer’s location is specified.
- moonDistfloat
Minimum distance between the Moon and the target in DEGREES. By default all Moon distances are acceptable (moonDist=0.0).
Only observations are listed for which the angular distance between the Moon and the target is larger than moonDist during the ENTIRE observation.
Note that this can only have an effect, if the observer’s location is specified.
- psT0float, optional
Phase-shift the transit midpoint. This may be useful to determine, e.g., eclipse times. In this case, psT0=0.5 may be suitable, which shifts T0 by 0.5 orbital periods. Default is 0.0
- fileOutputstring or file, optional
If a string is given, a file with the name will be created and the output will be written to that file. If a (writable) file object is given, the output will be written to that file. In both cases, no output will be given on screen.
- Returns
- Transit timesdictionary
Returns a dictionary containing the transit details. The dictionary key is a running number (starting with one), which is equivalent to that listed in the first column of the table.
For each transit, the function returns a dictionary with the transit details.
If the observer’s location was not specified, the dictionary has the following keys:
Key
Description
Planet name
Name of the planet
Tmid
HJD of transit center
Transit jd
Array giving JD of start, mid-time, and end of transit.
Obs jd
Array specifying the HJD of the start, center and end of the observation.
Obs cal
Equivalent to ‘Obs jd’, but in the form of the calendar date. In particular, for each date, a list containing [Year, month, day, fractional hours] is given.
Below follows optional output only present if the observer’s location is known
Obs coord
East longitude [deg], latitude [deg], and altitude [m] of the observatory.
Sun ra
Right ascension of the Sun at center of observation.
Sun dec
Declination of the Sun at center of observation.
Sun alt
Altitude of the Sun [deg] at begin, center, and end of the observation.
Sun az
Azimuth if the Sun [deg] at begin, center, and end of the observation.
Moon phase
Array giving lunar phase (in percent) at start, center, and end of the observation.
Moon AD
Angular distance between the target and the Moon at begin, center, and end of the observation [deg].
Moon ra
Right ascension of the Moon at begin, center, and end of the observation [deg].
Moon dec
Declination of the Moon at begin, center, and end of the observation [deg].
Star ra
Right ascension of the star [deg].
Star dec
Declination of the star [deg].
Star CP
Cardinal point of the star at begin, center, and end of the observation.
Star alt
Altitude of the star [deg] at begin, center, and end of the observation.
Star az
Azimuth of the star [deg] at begin, center, and end of the observation.
Twilight
The worst, i.e., brightest type of twilight encountered during the observation.
- PyAstronomy.pyasl.transitVisibilityPlot(allData, markTransit=False, plotLegend=True, showMoonDist=True, print2file=False)
Plot the visibility of transits.
This function can conveniently be used with the output of the transitTimes function.
- Parameters
- allDatadictionary
Essentially the output of transitTimes. A dictionary mapping consecutive numbers (one per transit) to another dictionary providing the following keys:
Key
Description
Planet name
Name of the planet
Transit jd
(Only if `markTransit is True) Array giving JD of start, mid-time, and end of transit.
Obs jd
Array specifying the HJD of the start, center and end of the observation.
Obs cal
Equivalent to ‘Obs jd’, but in the form of the calendar date. In particular, for each date, a list containing [Year, month, day, fractional hours] is given.
Obs coord
East longitude [deg], latitude [deg], and altitude [m] of the observatory.
Star ra
Right ascension of the star [deg].
Star dec
Declination of the star [deg].
Note
To use the list created by transitTimes, the LONGITUDE and LATITUDE of the observatory location must have been specified.
- markTransitboolean, optional
If True (default is False), the in-transit times will be clearly indicated in the plot. Note that this would not be the case otherwise, which is particularly important if extra off-transit time before and after the transit has been requested.
- showMoonDistboolean, optional
If True (default), the Moon distance will be shown.
- print2fileboolean or string, optional
If True, the plot will be dumped to a png-file named: “transitVis-“[planetName].png. The default is False. If a string is given, it specifies the name of the output file.
